Following on from my post where I graphed the AXA Sun Life Guaranteed Over 50 plan I thought I’d look at a more complex product to see what kind of graphs I could get out of it. Unlike the Over 50 plan, the AXA Sun Life 50 Plus Protector features a lump sum and premium that increases over time. There is also a maximum number of years that the premiums are payable for. As there are a number of extra rules it should produce some interesting graphs!
As before I’ll mention that I’m not writing this to offer an opinion on this particular product. I’m not a financial advisor. My interest is to show how you can convert the information about financial product into graphs. These graphs can be of great help in deciding whether a financial product is suitable for you.
I got a quote from their website for a 60 year old male paying in a premium of £7 per month. These figures are what I was quoted on the day I did the quote (late August 2008).
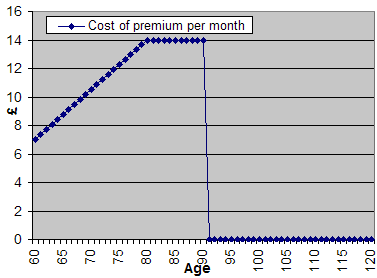
The premium of £7 will rise by £0.35 per year for a maximum of 20 years when it will be double the initial premium. It will then remain level until it stops altogether at the age of 90. The cash lump sum is payable on death after two years. It is £1095 and will rise by £50 per year. If you were to die within two years the lump sum would be 1.5x the amount paid into the plan. There is no cash in value – if you stop paying money into the plan you get nothing.
The first graph I’ll make is to show how your premiums vary over the years. You can see them increasing every year, until the age of 80 when they level off. After the age of 90 you don’t pay any more premiums.
The next graph shows the cumulative cost of all the premiums paid into the plan, against the value of the lump sum. You can see (if you look carefully) that the premiums paid line increases in angle for the first 20 years. It is then a straight line for the next 10 years. The line then goes flat from age 90 as no more premiums are payable. The lump sum payment starts off at 1.5x the amount of premiums paid in, after two years it goes to the full lump sum value which increases by £50 each year.
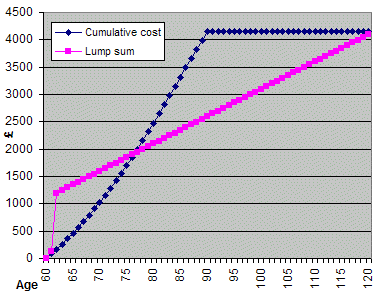
You can see that there is a crossover point at which you pay more in premiums than the lump sum you get back. You can also see that as you don’t pay any more premiums after age 90 the lines start coming together again. I continued the age range to 120 to see at what point they diverge for the second time.
I then produced a graph to show by what percentage the lump sum and the premiums go up. The text on their website says that both go up by 5% of the original lump sum / premium each year. An increase of £0.35 is indeed 5% of the £7 premium. However £50 of £1095 is actually 4.6%. I’m not sure whether they are rounding the lump sum increase down, or whether there is some error in their calculation.
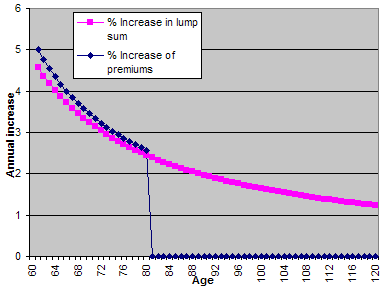
Despite the slight discrepancy in percentages both premium and lump sum follow an almost identical curve of decreasing percentage increases each year. The premium increases drop to 0% after the age of 80 as per the plan description. The lump sum increases by £50 each year so the percentage increase keeps dropping. It is therefore important to understand the effect that inflation will have on this plan.
I hope you found this interesting. These three graphs took me about 15 minutes to do and provide details of this product in a much easier to analyse format than the pure text description of the product as given on the AXA page.
As I started before I’m not offering you an opinion of their plan, more a reason why getting to grips with a spreadsheet package like Microsoft Excel will help you with making financial decision.