Here are some graphs showing income tax, national insurance, total tax and percentage of tax for the 2009-2010 tax year. I have also included a graph showing how total taxation has changed from the 2008-2009 tax year. If you want tax graphs for the current tax year go to my 2010-2011 tax graphs page.
I’ve done my best to make these accurate; however I’m not a tax expert so I can’t guarantee these are correct. These are therefore just for interest, and not for serious use.
2009-2010 income tax
First up income tax – everyone’s favourite tax!
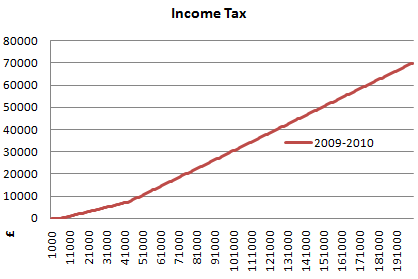
After a short tax free allowance you can see how the basic rate of tax hits, and then the higher rate of tax causes the angle to increase.
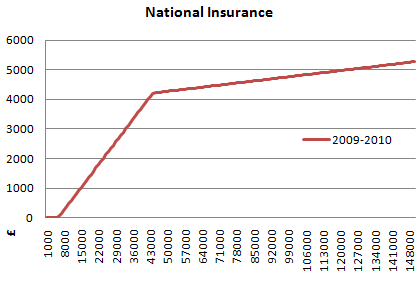
2009-2010 national insurance
National insurance follows a different shape as once you reach the higher band the rate drops to 1% rather than increasing.
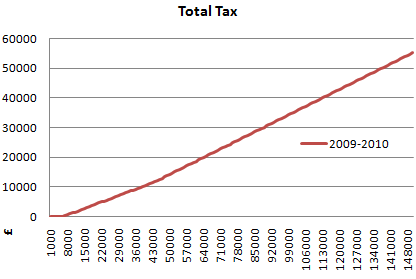
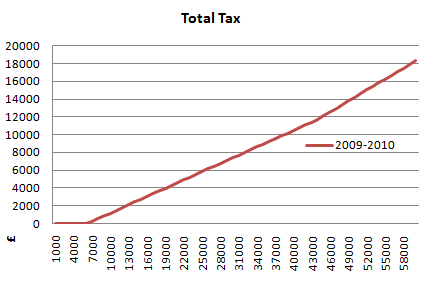
2009-2010 total tax
This graph combines both the income tax, and national insurance to show the total amount of these taxes that you would be paying.
And here is a version that is more zoomed in – it only goes up to £60,000.
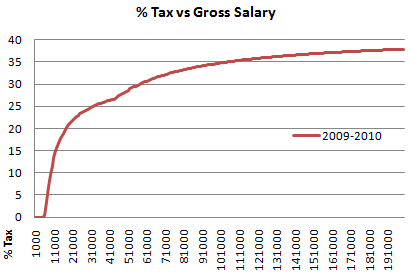
2009-2010 percentage of tax
Perhaps more interesting than the amount of tax you pay, is the percentage of tax you pay. This graph shows the combined income, and national insurances taxes against gross salary. The dip somewhere after the £40,000 level is due to the national insurance dropping to the 1% rate before the higher rate of income tax kicks in.
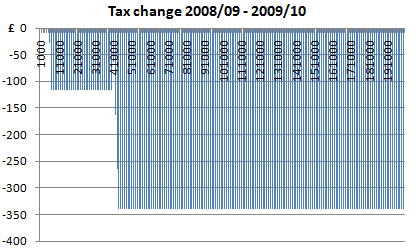
Change in tax from 2008/09 to 2009/10
This final graph shows how the amount of tax you pay has changed from the previous tax year, to the 2009/10 tax year. You can see that the amount of tax to be paid has actually decreased. This is due to the increase in personal allowance for 2009-2010.