Just for fun (and because I couldn’t find these anywhere) I’ve made some graphs showing the effects of different salary and dividend combinations on the amount of money you can move from your limited company into your personal account.
There are some assumptions I’ve had to make.
- This is for the 2012-2013 tax year.
- These figures are for a VAT registered company (standard VAT scheme, not flat rate), so turnover is net of VAT.
- No expenses or pension contributions are accounted for.
- You withdraw all retained profit (after paying salary and corporation tax) as dividends.
- Corporation tax is deducted at the small companies rate of 20%.
- You are under 65 and have the default personal allowance of £8105.
I’ll point out that I’m not an accountant so I don’t guarantee any kind of accuracy, but I’ve cross checked some of the figures against a few of those tax calculators that many accountancy companies have on their website and they seem to fit.
Salary vs money extracted from company
This graph shows how much money you could get out of your company depending on turnover and what salary you set yourself. By ‘take home money’ I mean the salary plus dividend remaining after all taxes have been paid. In other words the money that is left for you to spend.
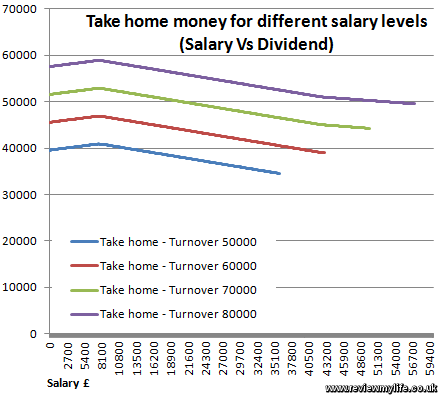
The lines stop at the point where the maximum amount of money has been extracted from the company.
Here is a simplified version just showing a turnover of £60,000. Note that the y-axis starts at £30,000.
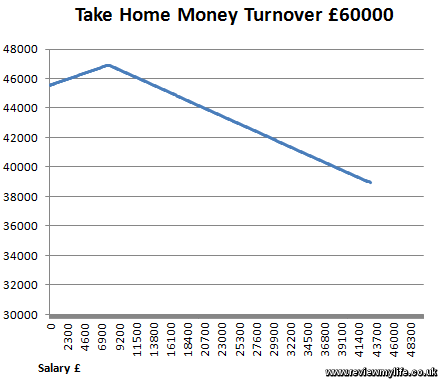
You can see that your extracted money goes up at first as your salary increases because you are making use of your personal allowance. Then it hits a very obvious peak after which income tax and national insurance kick in.
The maximum amount of money extracted is reached by paying salary at the national insurance secondary threshold level which is £144/week or £624 per month giving an annual salary of £7488.
In the above graph you can see that someone can take nearly £47,000 net out of the company. By doing this they dodge all national insurance payments, but as they are paying a salary above the lower earning limit they still get a full national insurance contribution record for the year. Their contribution is therefore subsidised by other workers who are paying national insurance. Is this a fair system? Probably not; a standard full time employee would have to earn about £69,000 gross and pay over £4500 in employee national insurance contributions to get this level of net income. However as long as this form of tax avoidance is legal you can’t really blame people for doing this.
Perhaps linking national insurance contributions to income with an upper cap would be a more effective way for HMRC to collect their NI money from everyone who can afford it.
Dividend vs salary with all taxes
This chart shows all the PAYE, corporation and dividend taxes. You might spot that the ‘Take home money’ and the ‘Total Tax’ are perfect mirror images of each other, and the two together add up to the turnover.
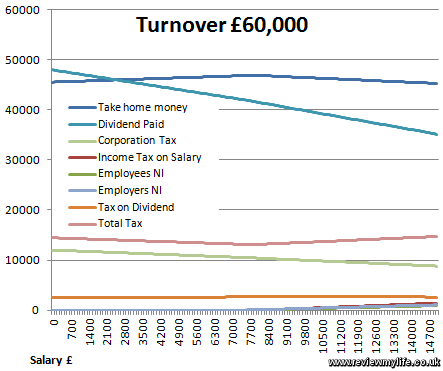
The dividend is the declared dividend paid to you which doesn’t include the 10% tax credit. At the start of the graph the dividend is above the ‘take home money’ because part of the dividend is then taxed at the higher rate.
And because the taxes are squashed at the bottom here is a more zoomed in version.
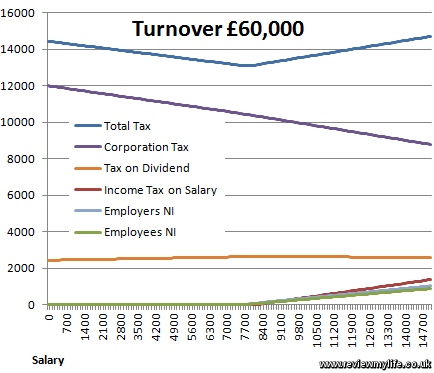
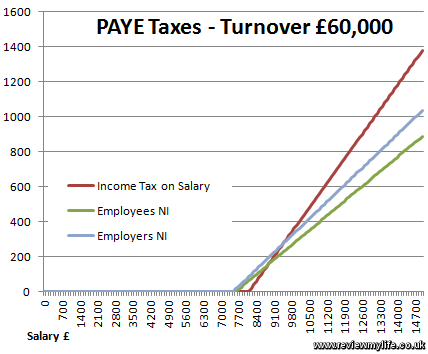
The total tax is including the employee PAYE, the employer NI, and any extra tax due on dividends. You can see that if you increased your salary from the secondary threshold level of £7488 to £15,000 you and your company would be paying an extra £1500+ of tax.
The final graph shows the income tax and national insurance.
I hope this is all correct – if you spot any mistakes do let me know and I’ll fix them.
Great post, it’s surprisingly rare to see people do this calculation. Don’t suppose you mind sharing your source spreadsheet please? I realise I’ll need to update it for current tax figures.