If you are trying to make a three point estimation spreadsheet for Excel but are struggling with the formulas, then this free Excel download that I’ve made may help you.

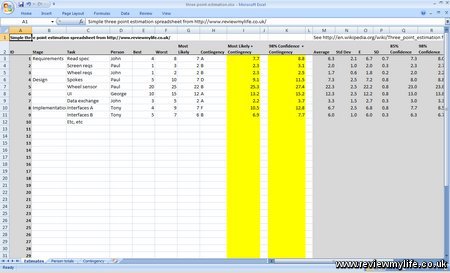
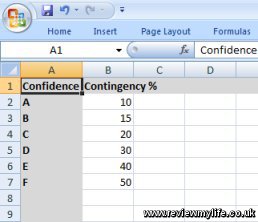
It has fields set up for entering data such as the task name, person responsible, and then the best, worst, and most likely estimates. You can also enter a contingency value as a letter. One of the spreadsheet tabs lets you set what percentage of contingency applies for each letter.

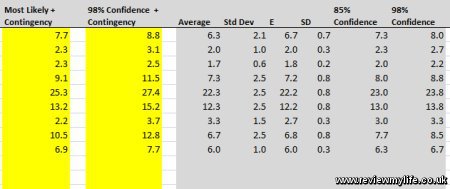
If you like your estimates to be based on the most likely plus the contingency, you’ll see this automatically calculated for you in the first yellow columns (you may have to copy the formulas down as far as you need them).
If you prefer your estimate to be based on E/SD/Confidence values you’ll find them to the right of the sheet. Also available are the average and standard deviation (of the best/worst/most likely). The second yellow column is the 98% confidence plus contingency value.

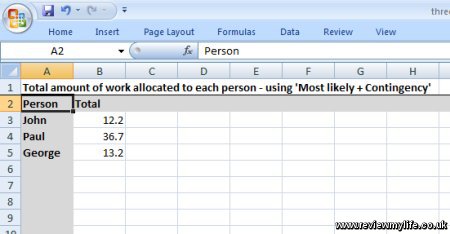
Finally if you want to see a quick summary of how much work is allocated to each person there is a tab which gives you this information.

This spreadsheet is by no means ready for immediate use, you’ll probably want to customise it, remove the columns that you don’t need, and verify that the formulas do what you want and are correct. But at least it may help you produce the three point estimation spreadsheet you want more quickly.
Download the three point estimation spreadsheet – Excel XLS (16kb zipped)
It has been tested on Microsoft Excel 2007 and is a free 16kb download.


Nice, but shouldn’t the confidence column headings be 68% and 95%, not 85% and 98%?