A Level Biology Project
Aims |
This is an experiment to examine how the concentration of the substrate hydrogen peroxide affects the rate of reaction of the enzyme catalase.
Introduction |
This is an A-level biology project. It helped me get an A grade for biology many years ago. The whole project is reproduced here for your reference.
- Aims
- Background Information
- Aparatus
- Method
- Prediction
- Results
- Interpretation
- Limitations
- Anomolies
- Extension Work
Background Information |
Enzymes such as Catalase are protein molecules which are found in living cells. They are used to speed up specific reactions in the cells. They are all very specific as each enzyme just performs one particular reaction.
Catalase is an enzyme found in food such as potato and liver. It is used for removing Hydrogen Peroxide from the cells. Hydrogen Peroxide is the poisonous by-product of metabolism. Catalase speeds up the decomposition of Hydrogen Peroxide into water and oxygen as shown in the equations below.
Formula:
                       Catalase
 Hydrogen Peroxide---------------------->Water + Oxygen

                       Catalase
             2H2O2------------------->2H2O+O2
It is able to speed up the decomposition of Hydrogen Peroxide because the shape of it's active site matches the shape of the Hydrogen Peroxide molecule. This type of reaction where a molecule is broken down into smaller pieces is called an anabolic reaction.
Apparatus Needed For The Experiments |
- Gas Syringe
- Metal Stand
- Yeast Catalase
- Hydrogen Peroxide
- Test Tubes
- Beakers
- Test Tube Rack
- Stop Watch
- Pipette
- Pipette Filler
- Tap Water
Method |
To test out how the concentration of hydrogen peroxide affects the rate of reaction first set up the apparatus below.
[Aparatus picture not reproduced]
1. Add 2cm3 of yeast to one test tube. Add 4cm3 of hydrogen peroxide solution at a concentration of 20% to the other test tube. Use a pipette to measure out the volumes. It is very important to accurately measure the amounts of Hydrogen Peroxide, Yeast and water to ensure a fair test.
2. Pour the hydrogen peroxide solution into the test tube containing the yeast and immediately put the gas syringe bung on the end of the test tube, at the same time start the stopwatch.
3. Bubbles should start to rise up the tube and the gas syringe will move outwards, as soon as the gas syringe passes the 30cm3 mark stop the stopwatch and note the elapsed time down to the nearest 1/10th of a second.
4. Repeat the experiment with hydrogen peroxide concentrations of 16%, 12%, 10%, 8%, 4% and 0%. The 0% concentration of hydrogen peroxide solution is done as a control solution to show that at 0% concentration no reaction occurs. The different concentrations of Hydrogen Peroxide are made by adding tap water to the 20% Hydrogen Peroxide in the correct amounts. The table below shows what amounts of Hydrogen Peroxide and water are needed to make the solutions.
|
Concentration Of Hydrogen Peroxide |
Volume Of Hydrogen Peroxide (cm3) |
Volume Of Water (cm3) |
| 20% | 4 | 0 |
| 16% | 3.2 | 0.8 |
| 12% | 2.4 | 1.6 |
| 10% | 2 | 2 |
| 8% | 1.6 | 2.4 |
| 4% | 0.8 | 3.2 |
| 0% | 0 | 4 |
5. Repeat all the tests at least three times so that an average can be obtained. Repeating the experiments several times will help to produce better and more accurate results as any inaccuracies in one experiment should be compensated for by the other experiments. Note all the results in a table such as the one below.
| Hydrogen Peroxide Concentration | 0% | 4% | 8% | 10% | 12% | 16% | 20% |
| Time Taken (Test 1) | |||||||
| Time Taken (Test 2) | |||||||
| Time Taken (Test 3) | |||||||
| Average of the Tests | |||||||
| Rate |
The rate can then be worked out by
Rate=30/Average Time
This gives the rate in cm3 of oxygen produced per second, this is because I am timing how long it takes to produce 30cm3 of oxygen. From these results a graph can be plotted with concentration on the x-axis and time taken on the y-axis.
I am using yeast catalase as opposed to catalase from apples, potatoes or liver because it is easier to get the desired amount of yeast catalase by simply measuring it off. To obtain catalase from a substance such as potato would involve crushing it and with that method you would never be sure of the concentration of the catalase. If the catalase was used up then another potato would have to be crushed and this could produce catalase of a totally different concentration which would lead to inaccuracies in the experiment making this an unfair test.
To ensure this is a fair test all the variables except for the concentration of Hydrogen Peroxide must be kept the same for all the experiments. Variables that must not be altered include:-
Temperature, yeast concentration, type of yeast, batch of yeast, volume of yeast, volume of hydrogen peroxide, air pressure and humidity.
When measuring the volumes of Hydrogen Peroxide, Yeast and Water the measurement should be taken by looking at the scale at an angle of 90 degrees to it to avoid any parallax error.
Predictions |
I predict that as the substrate concentration increases, the rate of reaction will go up at a directly proportional rate until the solution becomes saturated with the substrate hydrogen peroxide. When this saturation point is reached, then adding extra substrate will make no difference.
The rate steadily increases when more substrate is added because more of the active sites of the enzyme are being used which results in more reactions so the required amount of oxygen is made more quickly. Once the amount of substrate molecules added exceeds the number of active sites available then the rate of reaction will no longer go up. This is because the maximum number of reactions are being done at once so any extra substrate molecules have to wait until some of the active sites become available.
Results |
I carried out the above experiment and these results were obtained.
| Hydrogen Peroxide Concentration | 0% | 4% | 8% | 10% | 12% | 16% | 20% |
| Time Taken (Test 1) | 47.3 | 18.4 | 17.3 | 14.5 | 10.6 | 9.7 | |
| Time Taken (Test 2) | 43.3 | 19 | 16.7 | 14.9 | 11.2 | 10 | |
| Time Taken (Test 3) | 52.2 | 17.2 | 18.5 | 11.2 | 8.6 | 7.8 | |
| Average of the Tests | 47.6 | 18.2 | 17.5 | 13.5 | 10.1 | 9.2 | |
| Rate=30/Average (Cm3/second) | 0 | 0.63 | 1.65 | 1.71 | 2.22 | 2.97 | 3.26 |
All the times are in seconds. The average results are all written down to one decimal place because although the stopwatch gives results to two decimal places it is impossible to get accurate times to two decimal places due to the fact that our reaction times are not fast enough to stop the stopwatch precisely. I then worked out the rates of the reactions with the equation
Rate=30/Average Time
From these rates I was able to plot a graph of the rate of reaction against concentration of Hydrogen Peroxide.
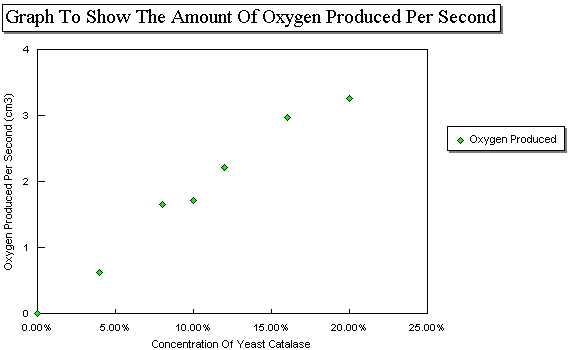
Interpretation |
When the concentration of Hydrogen Peroxide is increased, the rate of reaction increases at a directly proportional rate until the concentration of Hydrogen Peroxide reaches about 16%. If you double the concentration of Hydrogen Peroxide then the rate of reaction doubles as well. When the concentration is doubled from 8-16% the rate goes up from 1.65-2.97 Cm3 Oxygen produced per second, which is an increase of 1.8 times. I would expect the rate to increase two times if the Hydrogen Peroxide concentration is increased two times because there are twice as many substrate molecules which can join onto the enzymes active sites. The reason that the number is less than two times could be put down to the fact that at 16% the Enzyme's active sites may already be close to being saturated with Hydrogen Peroxide. There may also be some experimental error which causes the inaccuracies.
After 16% the increase in the rate of reaction slows down. This is shown by the gradient of the graph going down. At this point virtually all the active sites are occupied so the active sites are said to be saturated with Hydrogen Peroxide. Increasing the Hydrogen Peroxide Concentration after the point of saturation has been reached will not cause the rate of reaction to go up any more. All the active sites are being used so any extra Hydrogen Peroxide molecules will have to wait until an active site becomes available.
The theoretical maximum rate of reaction is when all the sites are being used but in reality this theoretical maximum is never reached due to the fact that not all the active sites are being used all the time. The substrate molecules need time to join onto the enzyme and to leave it so the maximum rate achieved is always slightly below the theoretical maximum. The time taken to fit into and leave the active site is the limiting factor in the rate of reaction.
The diagram below shows what happens.
[not reproduced]
Limitations |
To help make this experiment more accurate, I repeated it three times and then used the average of all the results to plot a graph with a line of best fit. I tried to keep all the variables except for the concentration of Hydrogen Peroxide the same for all the experiments. However, in reality it is impossible to keep all the variables precisely the same. For example:
a) There is a slight delay between pouring the Hydrogen Peroxide into the yeast, putting the bung on and starting the stopwatch. This will slightly affect all the results but as I carried out all the three steps in the same way for all the experiments it should not make any difference to the overall result.
b) It is also impossible to precisely measure out the amounts of Hydrogen Peroxide, Yeast and Water each time. As the scale on the pipettes shows the volume to the nearest mm3 the volume of the solutions that I used should be correct to the nearest mm3. The volume of gas in the test tube to start with is slightly affected by the amount which the bung is pushed down each time, if the bung is pushed down further then the volume in the tube will be less so the 30cm3 of gas is reached faster.
c) Due to the fairly slow speed of our reactions it is only possible to measure the time of the reaction to the nearest 0.1 second even though the stopwatch shows the measurements to the nearest 0.01 second.
Anomolies |
The plotted results on the graph produce a straight line of best fit to begin with which then goes into a curve of steadily decreasing gradient. The only anomalies are the results at 8% and 10%. The result at 8% is slightly above the line of best fit and the 10% result is slightly below it. This is probably due to an experimental error involving one of the factors mentioned above.
Extension Work |
This experiment could be improved in a number of ways. It could be repeated more times to help get rid of any anomalies. A better overall result would be obtained by repeating the experiment more times because any errors in one experiment should be compensated for by the other experiments.
Using more concentrations of Hydrogen Peroxide would have produced a better looking graph and I would have liked to use concentrations higher than 20% to extend the graph so that the maximum possible rate of reaction could be reached.
The problem of the delay between pouring in the Hydrogen Peroxide, bunging the test tube and starting the stopwatch could have been limited by getting another person to start the stopwatch when the hydrogen peroxide was poured into the tube.
DisclaimerThis is a real A-level school project and as such is intended for educational or research purposes only. Extracts of this project must not be included in any projects that you submit for marking. Doing this could lead to being disqualified from all the subjects that you are taking. You have been warned. If you want more help with doing your biology practicals then have a look at 'Advanced Level Practical Work for Biology' by Sally Morgan. If you want more detailed biology information then I'd recommend the book 'Advanced Biology' by M. Kent. |

Would it be possible to have the same/a similar title for my coursework? this is very helpful. Would be great to use this is a guideline. Obviously not to copy.
Hi H.H, yes you can use this title. It isn’t my title – it was actually a title set by the exam board during the year I did my A-Levels. Good luck with your coursework.
Am I allowed to use this for secondary data for my controlled assessment?
Hi Zoë, yes you can use the data as long as you reference this web page. Good luck!
Hi! I was wondering how i could reference this page in APA format. Since I don’t have an author’s name, I can barely reference this page properly…. Thanks!
The reaction that breaks down large molecules into smaller moleculs is catabolism not anabolic reaction.
and also, shouldnt your graph’s x axis title be ‘concentration of hydrogen peroxide’ instead of ‘concentration of yeast’?
No. The x axis is fine. Because he adds water to the yeast not to the peroxide to change the concentration. So the indepent variable is the yeast and the indepent variable should be the x-axis!
Its catabolic reaction not anabolic.
CATABOLIC=CUT
as my bio teacher says
As the concentration increased , the amount of oxygen decrease? Why you wrote that it is directly proportional?
Hi I was just wondering how to cite this page all I got is the page name there is barely anything to cite can you help me
Hi Skye, you could just cite the page URL, and page title. Thanks.
Seems to be useful article but on some points your not correct.
forexample you said;
“This type of reaction where a molecule is broken down into smaller pieces is called an anabolic reaction”.
What I know is that this type of reaction should be catabolism and not anabolism as you said.
anabolism and catabolism are two types of metabolism where the anabolism being building reaction and the catabolism being breaking reaction